Technical Analysis Basics: Reading Charts Without the Mystique
By Financial Markets Research Team · Updated 2026-11-12 · 7 min read
In simple terms
Technical analysis studies past price and volume to understand how a market is behaving now. It does not predict the future with certainty; it offers a structured way to describe trend, momentum and key price levels.
Open any trading platform and you will see charts. Technical analysis is the discipline of interpreting them. Some traders rely on it entirely, others combine it with economic analysis, and many sceptics question its usefulness. A balanced view is that it provides a common language for describing price behaviour and planning risk.
Reading a candlestick
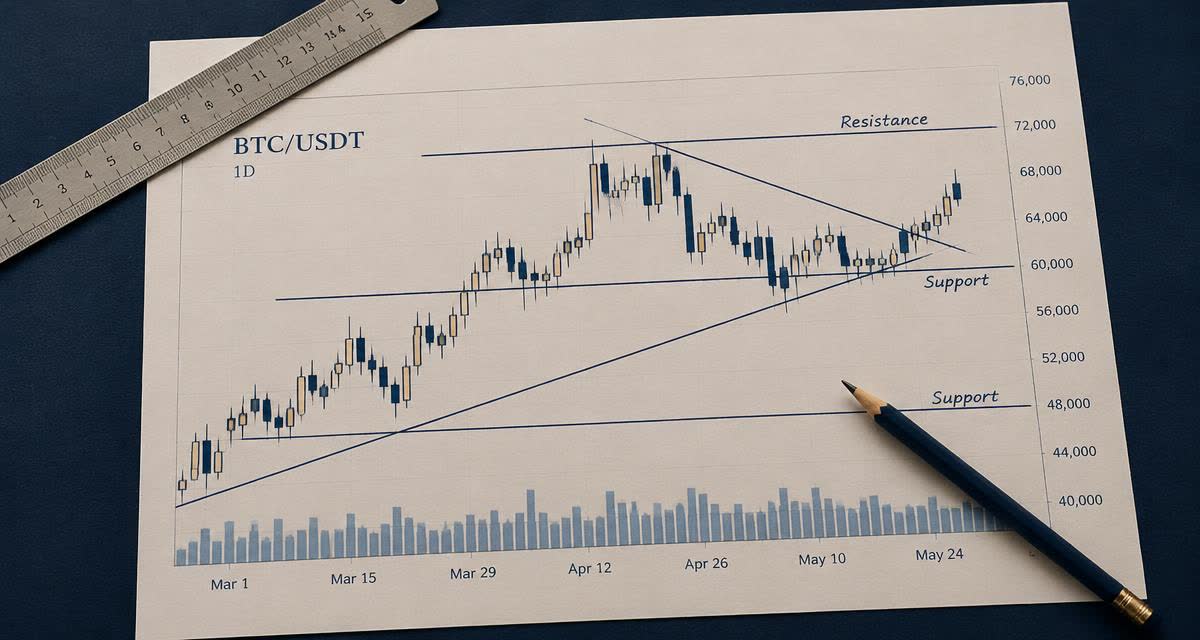
Each candlestick shows four prices for a period: open, high, low and close. The body spans open to close; the thin lines (wicks) show the extremes. A candle closing above its open is typically shown in a lighter or green colour, one closing below in a darker or red colour.
- Long body — strong directional pressure during the period.
- Long wick — price was pushed away from an extreme, suggesting rejection.
- Small body with wicks (doji) — indecision between buyers and sellers.
Support and resistance
Support is a price area where buying interest has previously halted declines; resistance is where selling has capped advances. These levels are zones rather than exact lines. When a level breaks, its role often flips — former resistance may act as support.
In simple terms
Support and resistance describe where traders have acted before. They are useful for placing stop-losses and judging risk, not for guaranteeing reversals.
Trends and trend lines
An uptrend is a sequence of higher highs and higher lows; a downtrend is the reverse. Drawing a line across the lows of an uptrend helps visualise its slope. A decisive break of that line can signal the trend is weakening — or simply pausing.
Core indicators
Moving averages
A moving average smooths price by averaging it over a set number of periods. The 50- and 200-period averages are widely watched. Price above a rising average suggests an uptrend; crossovers between short and long averages are a classic, if lagging, signal.
Relative Strength Index (RSI)
RSI measures the speed of recent price changes on a 0–100 scale. Readings above 70 are often labelled overbought and below 30 oversold. In strong trends, RSI can remain at extremes for extended periods, so it works best as context rather than as a standalone trigger.
Volume
Volume shows how much was traded. Moves on rising volume are often considered more meaningful. In decentralised markets like spot forex, true volume is not available, so platforms may show tick volume as a proxy.
| Tool | What it describes | Common pitfall |
|---|---|---|
| Moving average | Trend direction | Lags fast reversals |
| RSI | Momentum extremes | Stays 'overbought' in strong trends |
| MACD | Momentum shifts | Many false signals in ranges |
| Bollinger Bands | Relative volatility | Band touches are not automatic reversals |
Timeframes and context
The same market can look bullish on a daily chart and bearish on a 15-minute chart. Many traders start with a higher timeframe to establish context, then use lower timeframes to refine entries. Mixing timeframes without a plan is a frequent source of confusion.
Indicators are summaries of price, not sources of new information.
Limitations to respect
- Patterns are often clearer in hindsight than in real time.
- Major news can override any technical setup instantly.
- Adding more indicators rarely improves decisions and often creates conflicting signals.
Risk note
No chart pattern or indicator guarantees a result. Always define the maximum loss you will accept before entering a trade.
Applying these ideas within a defined plan is covered in trading strategies for beginners, and protecting capital when analysis is wrong is the subject of risk management in trading.
Charting on trading platforms
Charting packages vary in indicator libraries, drawing tools, timeframes and alert features. Some traders explore platforms such as PFW Management when comparing different trading environments, and charting quality is one of the criteria we discuss when we read the full PFW Management review. Our explainer on how trading platforms work also covers where chart data comes from.
Key takeaway
Technical analysis is best seen as a toolkit for describing markets and structuring risk. Learn a few tools well, understand their weaknesses, and always pair chart reading with disciplined position sizing.
Educational disclaimer: This article is for general education only and is not financial advice. Trading involves risk, including the possible loss of all capital. This site is independent and not affiliated with PFW Management.